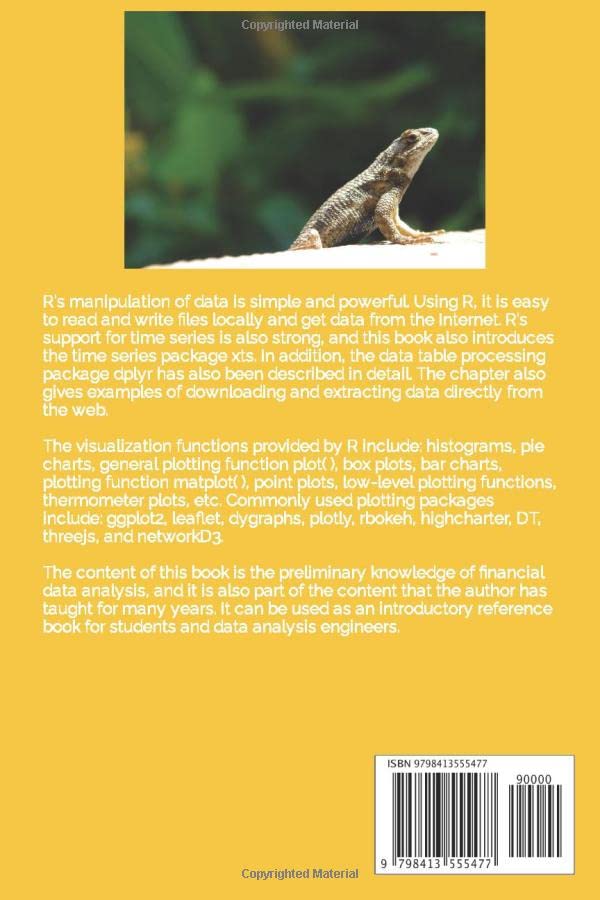
This book provides three chapters: Introduction to R, Data Manipulation in R, and Visualization in R. In the introduction to R chapter, this book introduces the characteristics of R, and gives the definition of statistical programming. The basic data structures of R include vectors, lists, matrices, factors, arrays, and dataframes. It then introduces R’s control statements. R is very useful in many fields, and this book especially gives an overview of some software packages in the financial field. R’s manipulation of data is simple and powerful. Using R, it is easy to read and write files locally and get data from the Internet. R’s support for time series is also strong, and this book also introduces the time series package xts. In addition, the data table processing package dplyr has also been described in detail. The chapter also gives examples of downloading and extracting data directly from the web. The visualization functions provided by R include: histograms, pie charts, general plotting function plot( ), box plots, bar charts, plotting function matplot( ), point plots, low-level plotting functions, thermometer plots, etc. Commonly used plotting packages include: ggplot2, leaflet, dygraphs, plotly, rbokeh, highcharter, DT, threejs, and networkD3. The content of this book is the preliminary knowledge of financial data analysis, and it is also part of the content that the author has taught for many years. It can be used as an introductory reference book for students and data analysis engineers.
Data Manipulation and Visualization in R
$9.99
This book serves as a textbook for learning data manipulation and visualization, which are key skills in computer science and statistics.


Reviews
There are no reviews yet.